


Table of Contents
Most agency owners watch one number, revenue, feeling good when it goes up. But revenue can rise while profit falls, so the metrics that tell you what is really happening are the ones most owners never look at. This guide covers the six KPIs that actually run a B2B travel agency.
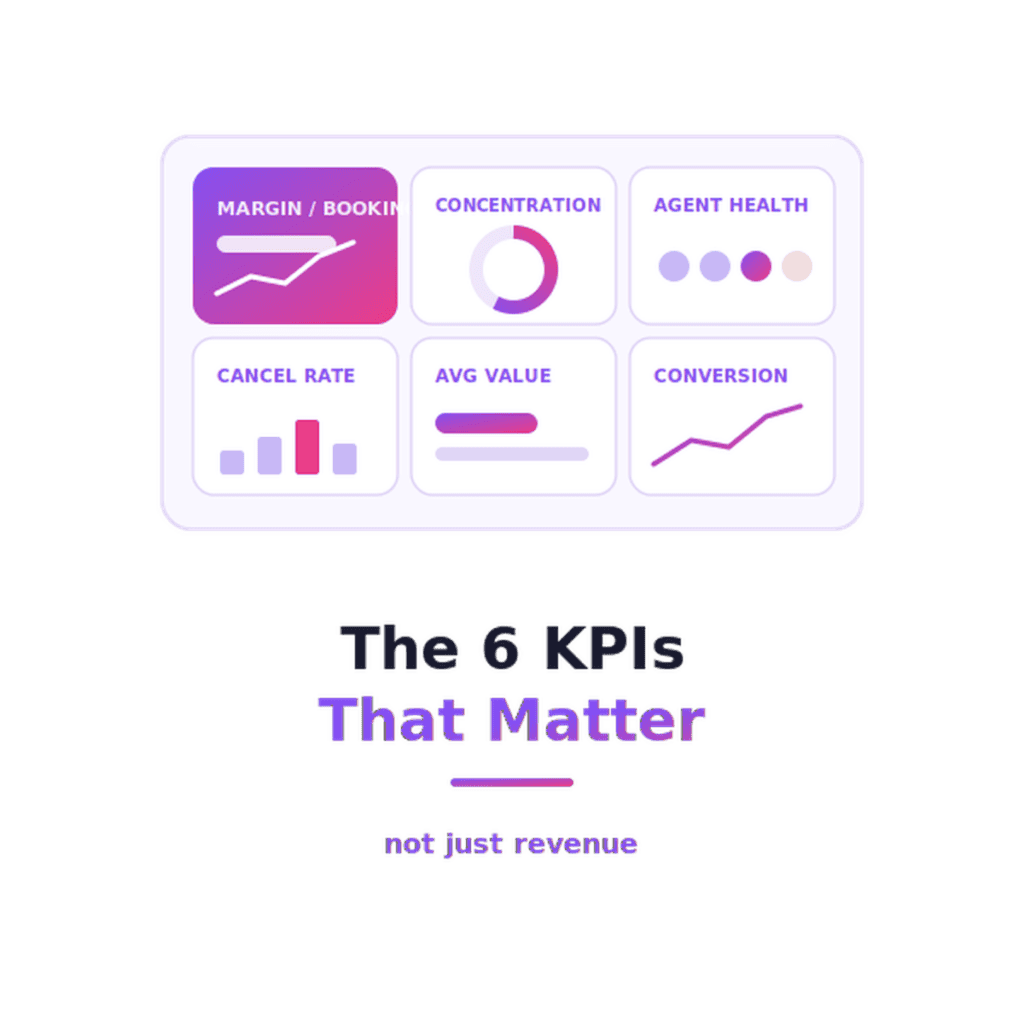
The six KPIs a B2B travel agency owner should track are margin per booking rather than gross revenue, supplier concentration to strengthen negotiations, agent performance and retention to protect your network, cancellation rate to spot problem supply and lost margin, average booking value to understand your mix, plus search-to-book conversion to see how well your platform turns demand into revenue. Watched together, these tell you not just whether the business is growing but whether it is growing profitably, which is the question revenue alone can never answer.
Written for B2B travel agency owners and founders
Every owner has a number they check first thing in the morning. For most it is revenue or booking count. Those numbers feel reassuring because they usually go up, but they are also the least informative metrics you have. A month of record revenue can hide a fall in margin, a supplier problem building quietly or a key agent about to leave. Watching only the headline is like driving by looking at the speedometer alone, ignoring the fuel gauge and the warning lights.
This guide is written for the owner who wants to see the whole dashboard. It sets out the six KPIs that reveal what is really happening in a B2B travel agency, what a healthy or unhealthy reading of each looks like and how the analytics inside B2B travel agency software surface them. For the specific reports that put these numbers in front of you, our guide to B2B travel portal analytics goes deeper.
Revenue tells you how much passed through your business, not how much you kept. An agency can grow its revenue by chasing high-value bookings that carry thin margins or by taking on a heavy agent who books a lot but pays little, so in both cases the top line rises while the money you actually earn does not. This is why so many agencies feel busier every year without feeling richer. They are optimising the number they watch rather than the number that matters.
The fix is to demote revenue from your headline metric to just one of several, then promote the numbers that describe profitability, health and risk. The six KPIs below do exactly that. None of them is hard to understand and none requires a data team, because a good platform surfaces them for you. What they require is the discipline to look at them regularly and to act on what they say, which is where the real advantage lies.
Margin per booking is the single most important KPI a B2B agency has, because it measures what you actually earn on each transaction after supplier cost and commission. Two agencies with identical revenue can be worlds apart on margin per booking. The one earning more per booking is the healthier business by far. Tracking it stops you celebrating revenue growth that is quietly eroding your profitability.
A healthy reading is a margin per booking that holds steady or rises as you grow. A warning sign is revenue climbing while margin per booking falls, which means you are buying growth by giving away margin, whether through discounting, a worsening supplier mix or heavy agents on thin terms. When you see that divergence, it is a signal to look at your pricing and your supplier deals, which we cover in our guide to markup and margin control.
Supplier concentration is the share of your bookings going to each supplier. It matters for two opposite reasons. On the upside, knowing your true volume with a supplier is the ammunition you need to negotiate a better commission tier. On the downside, leaning too heavily on one supplier is a risk, because if that supplier raises prices, degrades or drops out, a large slice of your business is exposed at once.
A healthy reading is volume spread across several suppliers, with your largest relationships giving you enough concentration to negotiate but not so much that a single supplier can hold you hostage. A warning sign is one supplier quietly growing to dominate your bookings, which is both a negotiation opportunity and a concentration risk. Either way, you can only manage what you can see, which is why concentration belongs on your dashboard rather than in your head.
An owner reviews supplier concentration and sees that one supplier now carries a large share of bookings. She reads it two ways at once. It is leverage, so she opens a commission negotiation backed by the exact volume figure. It is also a risk, so she starts building volume with a second supplier to reduce her exposure. The same KPI drives both a revenue move and a risk move, which is what makes it so useful.
Margin, concentration, agent performance and more, in one place instead of a spreadsheet.
See the B2B Travel Portal →For an agency built on a network of sub-agents, the health of that network is a core KPI. This has two parts. Agent performance is how much each agent books and earns you, seen per agent rather than as a blended total, so you can tell your growing agents from your stalling ones. Agent retention is whether you are keeping your agents, because a network that loses agents faster than it adds them is shrinking even if this month’s revenue looks fine.
A healthy reading is a stable or growing set of active agents, with your top agents growing and few going quiet. A warning sign is a rising number of agents who have stopped booking, which is often the first indicator that something is wrong before it shows up in revenue. Because a lost agent rarely announces their departure, simply booking less and then not at all, watching agent activity per agent is how you catch attrition early enough to do something about it. The per-agent view that makes this possible is covered in our guide to B2B travel portal analytics.
Cancellation rate is the share of bookings that get cancelled. It is a quiet but revealing KPI. A rising cancellation rate overall can point to a change in customer behaviour or a problem in your booking flow. More usefully, cancellation rate broken down by supplier is an early warning system, because a supplier whose cancellation rate is climbing is often a supplier heading for reliability trouble, sometimes before it produces outright booking failures.
A healthy reading is a stable, low cancellation rate that is broadly similar across your suppliers. A warning sign is one supplier’s cancellation rate rising above the others, which tells you to look closely at that supplier before its problems reach your agents. Cancellation rate is where reliability and margin meet, since every cancellation is both a service risk and, when a deadline is missed, a potential cost. We cover the operational side in our guide to managing what each sub-agent costs you.
Two more KPIs complete the set. Average booking value tells you about your mix, the typical size of a booking, which shapes everything from your margin strategy to which markets are worth pursuing. A shift in average booking value, up or down, tells you your business is changing shape, so it is worth understanding why before you react. Watched alongside margin per booking, it helps you see whether bigger bookings are actually more profitable or just larger.
Search-to-book conversion tells you how well your platform turns demand into revenue. If agents are searching heavily but booking little, something in the experience, the price, the availability or the speed, is letting demand slip away. A healthy conversion rate that holds steady means your platform is doing its job. A falling one is a prompt to look at whether your prices have drifted out of line, your search has slowed or your results have become cluttered, the last of which we cover in our guide to search speed and room deduplication.
A KPI is only worth tracking if it changes what you do. The value of these six is that each one points to a specific action when it moves the wrong way. Falling margin per booking sends you to your pricing and supplier deals. Rising supplier concentration sends you to a negotiation and a second supplier. Quiet agents send you to a retention conversation. A supplier’s climbing cancellation rate sends you to review that supplier. Each number is a trigger, not just a fact.
The other half of the value is having these numbers in one place, next to the controls that let you act on them, rather than scattered across spreadsheets you rarely open. When your KPIs and your levers live in the same platform, the distance between noticing a problem and fixing it collapses. To see how KPI tracking fits alongside pricing, supply and reporting, start with the pillar guide to B2B travel agency software.
See margin per booking, supplier concentration, agent health and more in one place, next to the controls to act on them. See it configured for your agency.
Six matter most. Margin per booking rather than gross revenue, so you track what you keep. Supplier concentration, both to negotiate better tiers and to manage the risk of leaning too heavily on one supplier. Agent performance and retention, seen per agent, to protect your network. Cancellation rate, especially by supplier, as an early warning of reliability trouble. Average booking value, to understand your mix. And search-to-book conversion, to see how well your platform turns demand into revenue. Together they show whether the business is growing profitably, not just growing.
Because revenue measures what passed through your business, not what you kept. An agency can grow revenue by chasing high-value but thin-margin bookings or by taking on a heavy agent who books a lot but pays little, so in both cases the top line rises while profit does not. That is why many agencies feel busier every year without feeling richer. Demoting revenue to one of several metrics, then promoting margin per booking and the other KPIs, is how you see whether growth is actually profitable.
Rather than a fixed number, which varies by market and model, the healthy pattern is a margin per booking that holds steady or rises as you grow. The warning sign is revenue climbing while margin per booking falls, which means you are buying growth by giving away margin, whether through discounting, a worsening supplier mix or heavy agents on thin terms. When you see that divergence, it is a signal to review your pricing rules and supplier deals before the erosion compounds.
By watching agent activity per agent rather than as a blended total, because a lost agent rarely announces their departure. They simply book less and then not at all. A rising number of agents who have gone quiet is often the first sign that something is wrong, before it shows up in overall revenue. Seeing each agent’s activity on its own lets you spot an agent cooling off and open a retention conversation while there is still a relationship to save, rather than discovering the loss only when the numbers finally dip.
Because a supplier whose cancellation rate is climbing is often a supplier heading for reliability trouble, sometimes before it produces outright booking failures. An overall cancellation rate is useful, but broken down by supplier it becomes an early warning system. When one supplier’s cancellation rate rises above the others, it tells you to look closely at that supplier before its problems reach your agents. Cancellation rate is where reliability and margin meet, since every cancellation is a service risk and, when a deadline is missed, a potential cost.
Six KPIs that run a B2B travel agency. Track each one and act when it moves the wrong way.
'+ '| KPI | Healthy reading | Warning sign | Your value |
|---|---|---|---|
| Margin per booking | Holds or rises as you grow | Revenue up while margin falls | |
| Supplier concentration | Spread, enough to negotiate | One supplier dominating | |
| Agent performance / retention | Stable or growing active agents | Agents going quiet | |
| Cancellation rate (by supplier) | Low and even across suppliers | One supplier rising above rest | |
| Average booking value | Understood and stable | Shifting without a known reason | |
| Search-to-book conversion | Steady | Falling: price, speed or clutter |
Tracker by ZentrumHub. zentrumhub.com/blog/b2b-travel-agency-kpis. Book a demo at zentrumhub.com/book-time
'+ ''; var w = window.open('', '_blank'); w.document.write(html); w.document.close(); w.focus(); setTimeout(function(){ w.print(); }, 350); }