






Table of Contents
Most travel agencies run on instinct. They have a rough sense of which suppliers matter and which agents perform, formed from whoever called most recently. The agencies that grow fastest replace that instinct with numbers. This guide covers the reports that let you do the same.
B2B travel portal analytics turn a stream of bookings into decisions. The three reports that matter most to an agency owner are supplier concentration, which shows where your volume actually goes so you can negotiate better rates, per-client performance, which isolates each sub-agent so you know who to invest in, plus commission visibility, which shows true earnings rather than gross revenue. Together they replace guesswork with evidence. Evidence is what grows margin.
Written for B2B travel agency owners and founders
Ask an agency owner who their biggest supplier is and you will usually get a confident answer. Ask them to prove it with a number and the confidence fades. Most agencies operate on an impression of their own business. Impressions are shaped by recency and noise rather than fact. The supplier who called last week feels important. The agent who complains loudest feels significant. The reality, hidden in the booking data, is often quite different.
This guide is written for the owner who wants to run on fact instead. It covers the specific reports that turn raw bookings into commercial decisions, with a worked example of each. It also shows how the analytics inside B2B travel agency software put that evidence in front of you without a data team.
Running an agency on instinct is expensive in ways that never show up as a single obvious loss. You leave supplier commission on the table because you cannot prove the volume you deliver. You keep pouring attention into an agent who feels important while a quietly growing one gets ignored. You chase revenue that looks big but earns little once commission is stripped out. None of these mistakes announce themselves, which is exactly why they persist.
Analytics fix this by making the invisible visible. When you can see where volume really goes, which agents really perform and what you really earn, the decisions almost make themselves. The goal is not dashboards for their own sake. The goal is a handful of reports that each answer a question you are currently guessing at. The three below answer the most valuable questions a B2B agency has.
The single most valuable report for margin is supplier concentration, which shows what share of your bookings goes to each supplier. It matters because supplier commission tiers are volume based. You cannot ask for a better rate if you cannot prove the volume you send. Most agencies systematically under-claim their own volume because they are guessing at it.
With a concentration report you walk into a supplier conversation with a precise figure rather than a vague sense that you send them a lot. That precision changes the conversation. A supplier who sees a concrete, verifiable volume claim has a reason to offer a better tier. You have the evidence to hold them to it. On ZentrumHub this data sits in the analytics view, ready to take into your next negotiation.
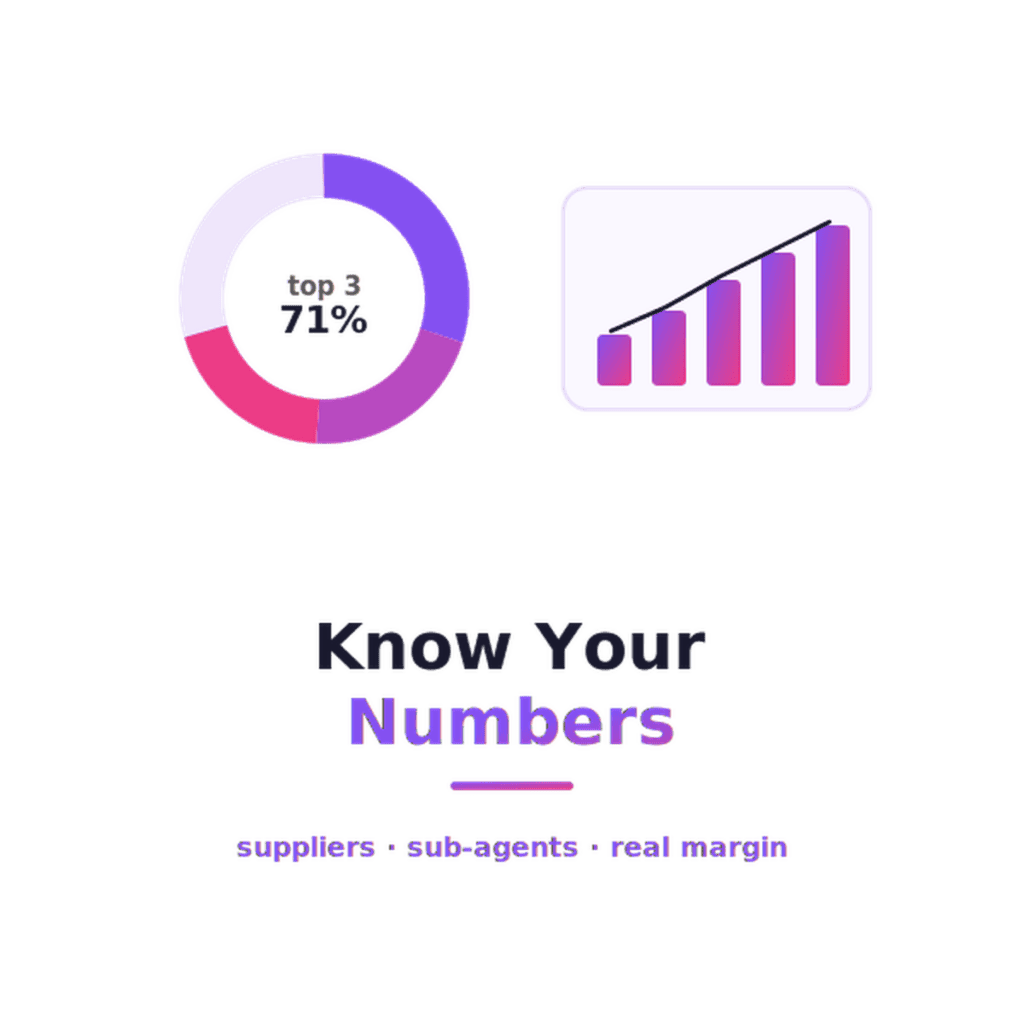
An agency reviews supplier concentration and finds that 30 percent of its bookings go to one chain, 21 percent to another and 20 percent to a third. It takes those precise figures into its next negotiations, replacing an estimate with a verifiable volume claim. It discovers it had been under-claiming its own volume, then secures better commission tiers as a result.
Walk into every supplier negotiation with a number instead of a guess.
See the B2B Travel Portal →The second report answers a different question. Which of your sub-agents actually deserve your attention. A blended total tells you the business is growing or shrinking, but it hides the individual stories underneath, where one agent is climbing, another is stalling and a third is quietly unprofitable. To manage a distribution network you have to see each relationship on its own.
ZentrumHub provides a per-client focus view that isolates a single sub-agent and shows their bookings, revenue, commission and average booking value on their own. With it you can see who is growing and deserves better terms, who is stalling and needs a conversation, plus who is costing more than they bring in. This is the difference between managing a loose collection of agents and running a deliberately optimised network. It pairs directly with the cost side covered in our guide to what each sub-agent costs you.
An owner opens the per-client view and sees one agency climbing month on month while another has flattened. She offers the growing agency a more generous commission split to lock in the relationship, then opens a conversation with the stalling one to find out what is holding it back. Both decisions are driven by each agent on their own numbers, not by a blended total that would have hidden both stories.
The third report separates what you sold from what you earned. Gross booking value is a vanity number. A booking worth a lot at face value can earn very little once the supplier cost and commission are accounted for, while a smaller booking on a high-commission supplier can be more profitable. If you optimise for gross revenue you can grow the top line while the bottom line stagnates.
Commission visibility shows the earnings behind the revenue, so you can see which suppliers, agents and destinations are actually profitable rather than merely large. This changes what you promote, who you reward and how you price, because you are steering by real margin instead of headline volume. Combined with the pricing controls in our guide to markup and margin control, it closes the loop between seeing margin and acting on it.
Beyond suppliers and agents, it helps to see where and when you sell. City concentration shows which destinations drive your business, which is where a direct contract or a preferred-supplier deal would have the most impact. Seasonality shows the shape of your demand across the year, which is where peak-date pricing earns the most. These are strategic views rather than daily ones, but they point you toward the moves that move the numbers.
The value is focus. An agency cannot negotiate every hotel or price every date, so knowing that a handful of cities and a handful of peak periods drive a large share of your business tells you exactly where to spend your limited commercial energy. That is analytics doing its real job, which is not describing the past but directing the next decision.
A concentration report shows an agency that three cities account for most of its bookings. It pursues direct contracts in exactly those three, rather than spreading effort thinly across dozens. It aims its peak-date pricing at the festival and holiday weeks the seasonality view highlights. Limited commercial energy goes where the data says it will earn the most.
Analytics only pay off when they change what you do. The pattern is always the same. A report reveals something you were guessing at. A control lets you act on it. Supplier concentration reveals your real volume, then a negotiation captures a better rate. Per-client performance reveals a stalling agent, then a conversation or a better split responds. Commission visibility reveals a low-margin favourite, then your pricing and promotion adjust.
This is why analytics belong in the same platform as your pricing, supply and channels rather than in a separate spreadsheet. When the report and the lever live together, the distance between insight and action collapses to a single session in your back office. To see how analytics fit alongside every other capability, start with the pillar guide to B2B travel agency software.
See supplier concentration, per-client performance and real commission earnings in one place, next to the controls that let you act on them. See it configured for your agency.
Three reports carry most of the value. Supplier concentration shows what share of your bookings goes to each supplier, which is your ammunition for negotiating better commission tiers. Per-client performance isolates each sub-agent so you can see who to invest in and who is unprofitable. Commission visibility shows real earnings rather than gross booking value, so you steer by margin. City and season concentration add strategic focus. The aim is a small set of reports that each drive a decision, not a wall of dashboards.
Supplier commission tiers are based on the volume you send, so you cannot ask for a better rate without proving that volume. A concentration report gives you a precise share for each supplier, which turns a vague claim that you send them a lot into a verifiable number. Most agencies find they had been under-claiming their own volume. Walking into a negotiation with the exact figure gives a supplier a concrete reason to offer a better tier and gives you the evidence to hold them to it.
A blended total tells you whether the business is growing, but it hides the individual stories underneath. One agent may be climbing while another stalls and a third quietly loses you money, while an overall number averages all three into a single figure that conceals every one. A per-client focus view isolates a single sub-agent and shows their bookings, revenue, commission and average booking value on their own, so you can reward the growing agents, help the stalling ones and stop subsidising the unprofitable ones.
Because gross booking value is a vanity number. A booking that looks large at face value can earn very little once supplier cost and commission are stripped out, while a smaller booking on a high-commission supplier can be more profitable. If you optimise for gross revenue you can grow the top line while the bottom line stagnates. Commission visibility shows the earnings behind the revenue, so you can see which suppliers, agents and destinations are genuinely profitable and steer by real margin.
No. It is better if you do not. Analytics pay off only when they change what you do. That happens fastest when the report and the control that acts on it live in the same platform. On ZentrumHub the analytics sit alongside your pricing, supply and channels, so a concentration report leads straight into a rate change, a per-client view leads straight into a better split, plus a commission report leads straight into a pricing adjustment. Keeping insight and action together collapses the distance between seeing a problem and fixing it.


Drop your work email and we’ll send you the 12-page report that breaks down where 6–9 months and $215K+ quietly disappear — free.

